Relationship Duration
Datawrangling
Wrangle data
Relationship duration
Factor1 relationship duration
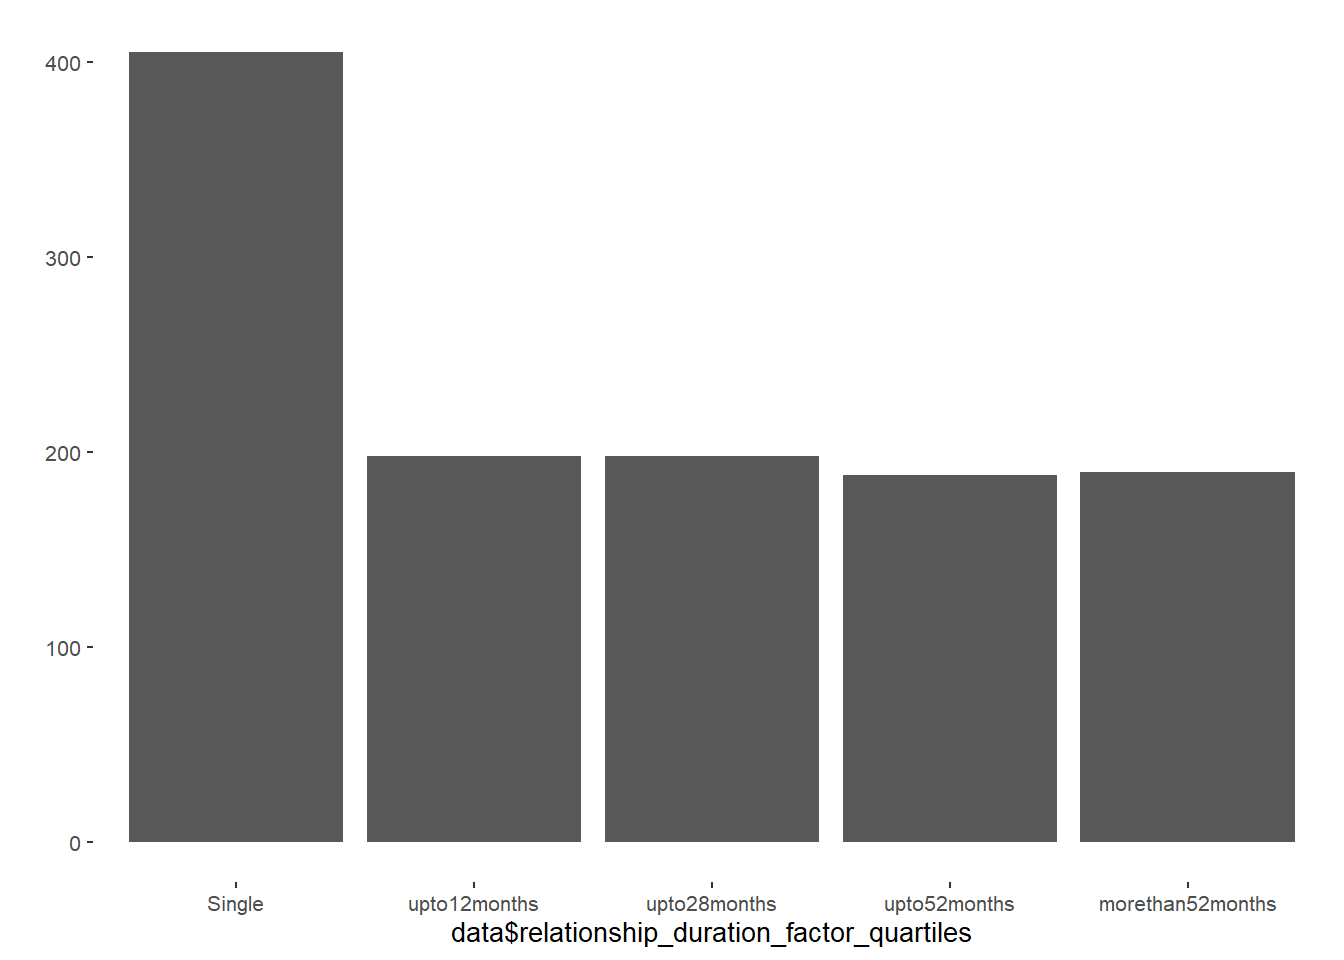
Divide relationship duration into quartiles
data = data %>%
   mutate(relationship_duration_factor_quartiles =
            factor(ifelse(relationship_status == "Single",
                   "Single",
                   ifelse(relationship_duration <= 12,
                          "upto12months",
                          ifelse(relationship_duration <= 28,
                                 "upto28months",
                                 ifelse(relationship_duration <= 52,
                                        "upto52months",
                                        ifelse(relationship_duration > 52,
                                        "morethan52months",
                                        NA))))),
                   levels = c("Single", "upto12months",
                              "upto28months", "upto52months",
                              "morethan52months")))


data %>%
  group_by(relationship_duration_factor_quartiles) %>%
  summarise(count = n()) %>%
  add_column(duration_in_years = c("Single",
                                   "upto1year",
                                   "upto2.3years",
                                   "upto4.3years",
                                   "morethan4.3years")) %>%
  select(relationship_duration_factor_quartiles, duration_in_years, count) %>%
kable()| relationship_duration_factor_quartiles | duration_in_years | count |
|---|---|---|
| Single | Single | 405 |
| upto12months | upto1year | 198 |
| upto28months | upto2.3years | 198 |
| upto52months | upto4.3years | 188 |
| morethan52months | morethan4.3years | 190 |
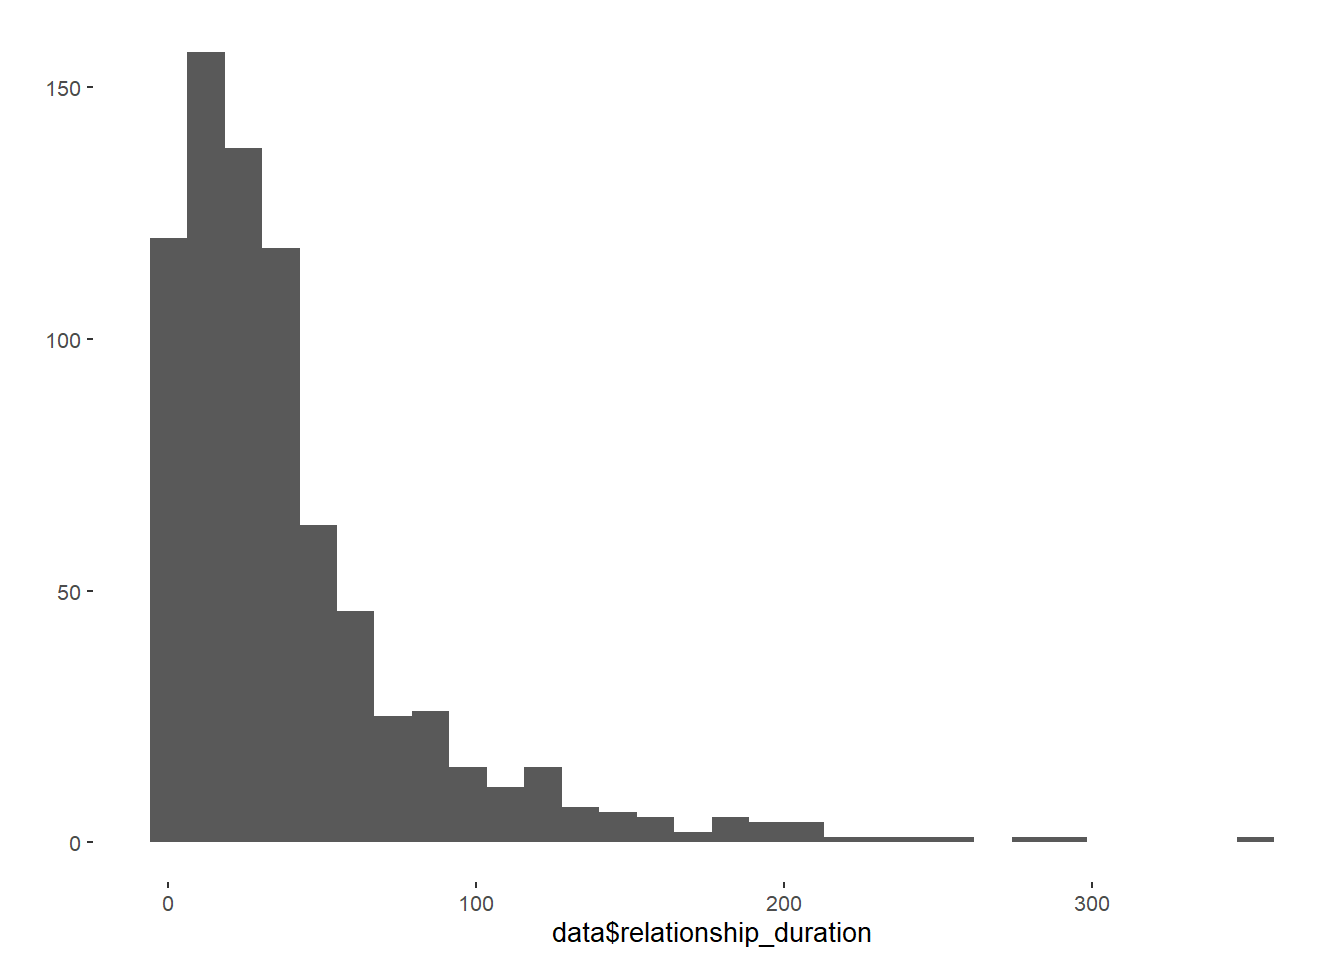
plot = ggplot(data, aes(relationship_duration)) +
  geom_histogram(aes(fill = relationship_duration_factor_quartiles), bins = 300) +
  labs(x = "Relationship Duration (in months)",
       y = "Count") +
  scale_x_continuous(breaks = c(c(0:30) * 12),
                     labels = c(c(0:30) * 12)) +
  apatheme +
  #theme(legend.position = "bottom") +
  theme(axis.text.x = element_text(angle = 90, vjust = 0.5, hjust=1)) +
  scale_fill_manual(name = "Categories\nRelationship\nDuration",
                    labels = c("0‒12 months",
                                 "13‒28 months",
                                 "29‒52 months",
                                 "> 52 months"),
                    values = c("#1B9E77", "#7570B3", "#D95F02", "#E7298A"))

jpeg('Relationship Duration.jpg',
     width = 700, height = 500, quality = 100)
plot
dev.off()
## png
## 2Factor2 relationship duration
Divide relationship duration into 8 quantiles
quantiles = quantile(as.numeric(data$relationship_duration),
                     na.rm = T,
                     probs = c(0, 0.125, 0.25, 0.375, 0.5,0.625, 0.75, 0.875, 1))

data = data %>%
  mutate(relationship_duration_factor_finegrained =
           factor(ifelse(relationship_status == "Single",
                  "Single",
                  ifelse(relationship_duration <= quantiles[2],
                         "upto6months",
                         ifelse(relationship_duration <= quantiles[3],
                                "upto12months",
                                ifelse(relationship_duration <= quantiles[4],
                                       "upto20months",
                                       ifelse(relationship_duration <= quantiles[5],
                                              "upto28months",
           ifelse(relationship_duration <= quantiles[6],
                  "upto38months",
                  ifelse(relationship_duration <= quantiles[7],
                         "upto52months",
                         ifelse(relationship_duration <= quantiles[8],
                                "upto85months",
                                ifelse(relationship_duration > quantiles[8],
                                       "morethan85months",
                                       NA))))))))),
           levels = c("Single", "upto6months", "upto12months",
                      "upto20months", "upto28months",
                      "upto38months", "upto52months",
                      "upto85months", "morethan85months")))

data %>%
  group_by(relationship_duration_factor_finegrained) %>%
  summarise(count = n()) %>%
  add_column(duration_in_years = c("Single",
                                   "upto0.5years",
                                   "upto1year",
                                   "upto1.7year",
                                   "upto2.3years",
                                   "upto3.2years",
                                   "upto4.3years",
                                   "upto7.1years",
                                   "morethan7.1years")) %>%
  select(relationship_duration_factor_finegrained, duration_in_years, count)  %>%
kable()| relationship_duration_factor_finegrained | duration_in_years | count |
|---|---|---|
| Single | Single | 405 |
| upto6months | upto0.5years | 120 |
| upto12months | upto1year | 78 |
| upto20months | upto1.7year | 98 |
| upto28months | upto2.3years | 100 |
| upto38months | upto3.2years | 96 |
| upto52months | upto4.3years | 92 |
| upto85months | upto7.1years | 93 |
| morethan85months | morethan7.1years | 97 |
qplot(data$relationship_duration_factor_finegrained) +
  theme(axis.text.x = element_text(angle = 90, vjust = 0.5, hjust=1))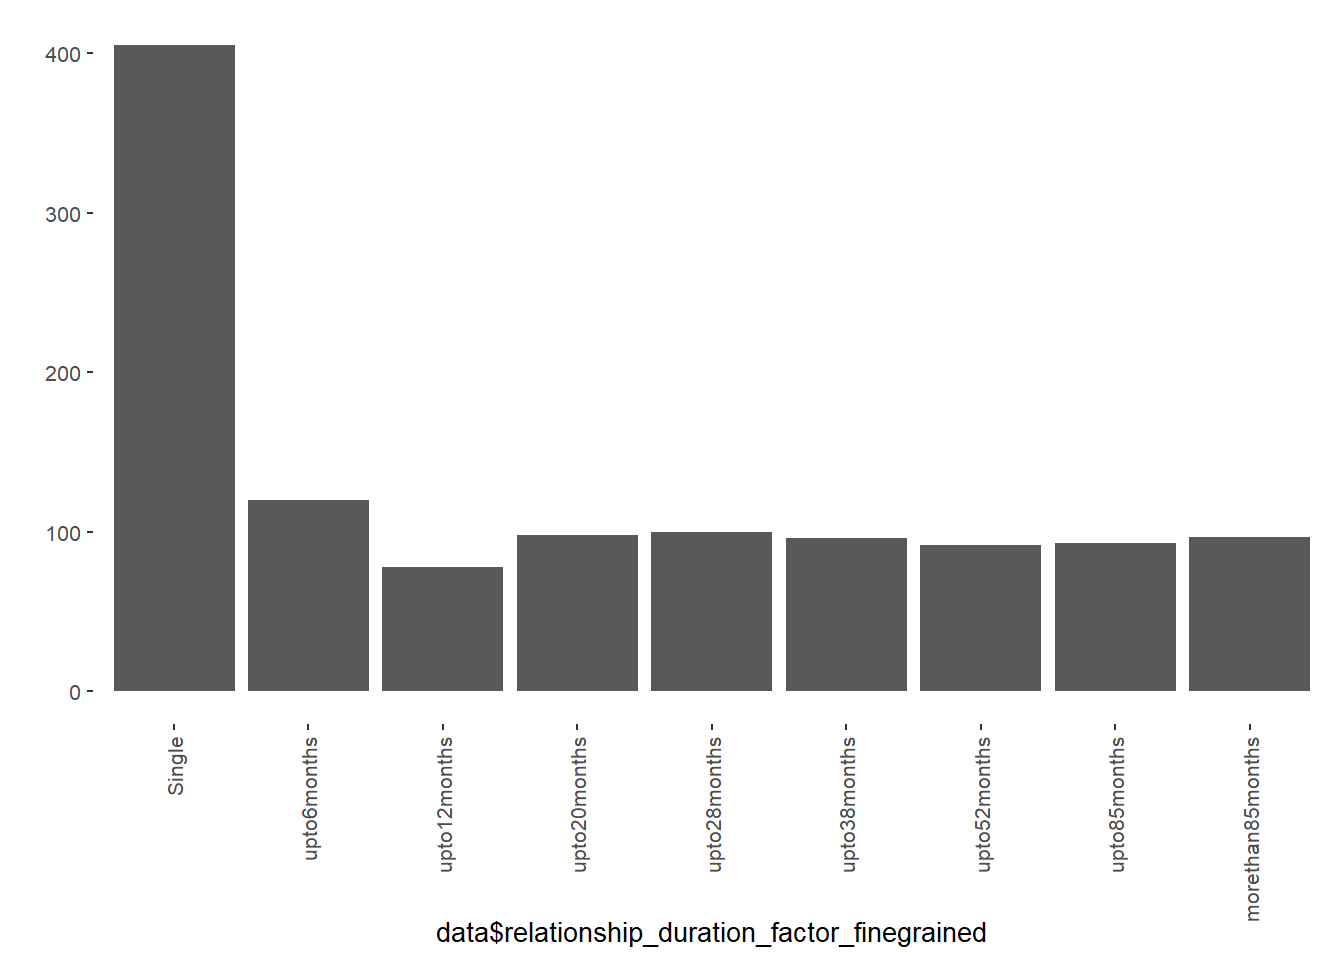
ggplot(data, aes(relationship_duration)) +
  geom_histogram(aes(fill = relationship_duration_factor_finegrained), bins = 200) +
  theme(legend.title = element_blank(), legend.position = "bottom")
Factor3 relationship duration
https://sci-hub.st/10.1016/j.ssresearch.2015.01.009 Effects of relationship duration, cohabitation, and marriage on the frequency of intercourse in couples: Findings from German panel data
Relationship Duration * 0-5 months * 6-11 months * 1-2 years * 2-3 years * 3-4 years * 4-5 years * 5-6 years * 6-8 years * 8-10 years * 10-12 years * 12-14 years * 14-16 years * > 16 years
data = data %>%
  mutate(relationship_duration_factor_schroeder =
           factor(ifelse(relationship_status == "Single",
                  "Single",
                  ifelse(relationship_duration < 6,
                         "0to5months",
                         ifelse(relationship_duration < 12,
                                "6to11months",
                                ifelse(relationship_duration <= 24,
                                       "1to2years",
                                       ifelse(relationship_duration <= 36,
                                              "2to3years",
           ifelse(relationship_duration <= 48,
                  "3to4years",
                  ifelse(relationship_duration <= 60,
                         "4to5years",
                         ifelse(relationship_duration <= 72,
                                "5to6years",
                                ifelse(relationship_duration <= 96,
                                       "6to8years",
                                       ifelse(relationship_duration <= 120,
                                              "8to10years",
           ifelse(relationship_duration > 120, "morethan10years",
                  NA))))))))))),
           levels = c("Single", "0to5months", "6to11months",
                      "1to2years", "2to3years",
                      "3to4years", "4to5years",
                      "5to6years", "6to8years",
                      "8to10years", "morethan10years")))

data %>%
  group_by(relationship_duration_factor_schroeder) %>%
  summarise(count = n()) %>%
kable()| relationship_duration_factor_schroeder | count |
|---|---|
| Single | 405 |
| 0to5months | 92 |
| 6to11months | 88 |
| 1to2years | 160 |
| 2to3years | 125 |
| 3to4years | 93 |
| 4to5years | 52 |
| 5to6years | 44 |
| 6to8years | 47 |
| 8to10years | 25 |
| morethan10years | 48 |
qplot(data$relationship_duration_factor_schroeder) +
  theme(axis.text.x = element_text(angle = 90, vjust = 0.5, hjust=1))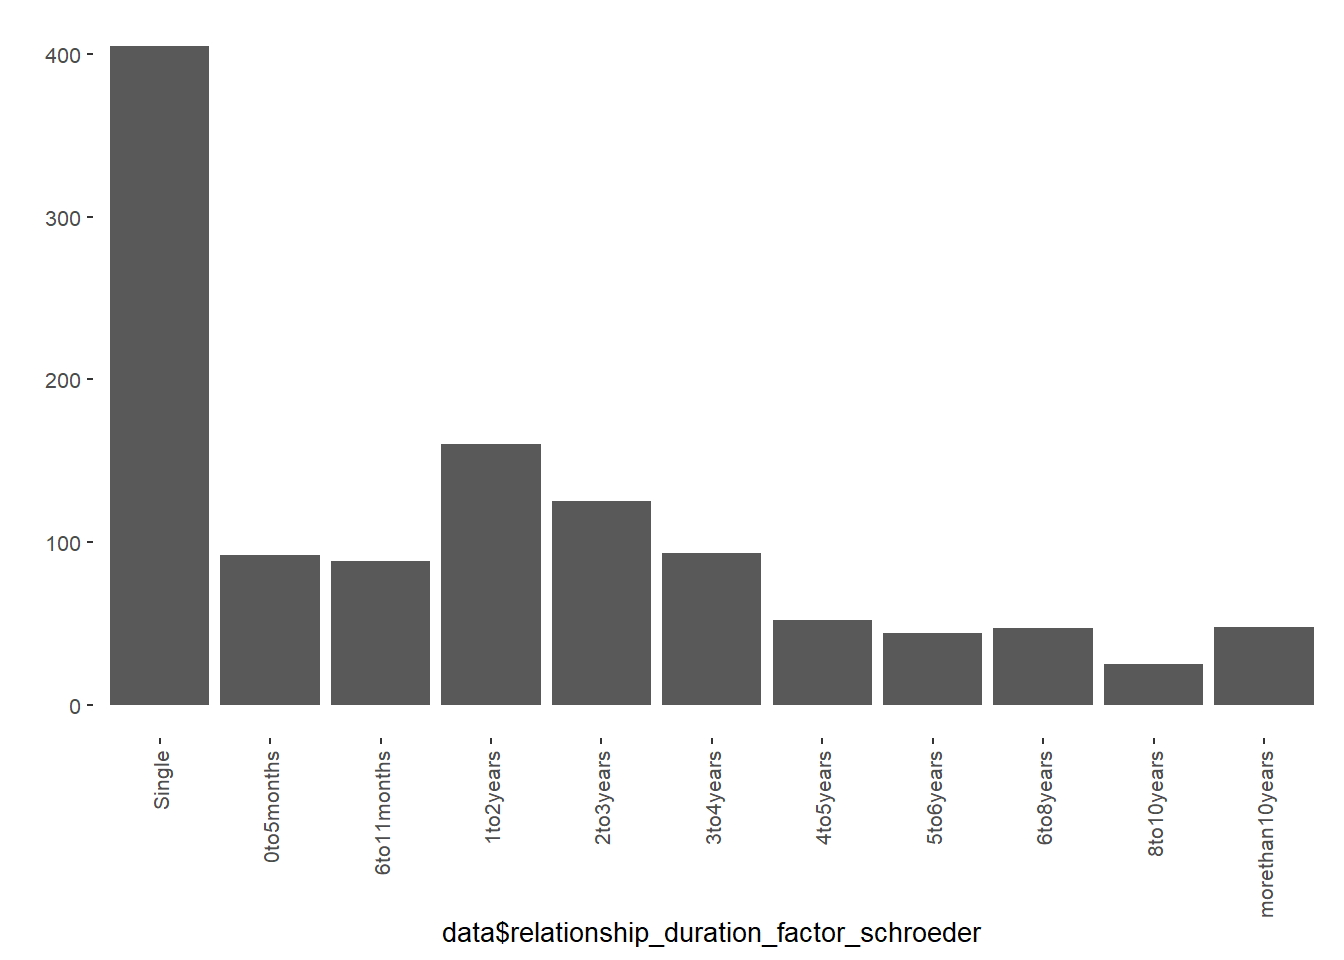
ggplot(data, aes(relationship_duration)) +
  geom_histogram(aes(fill = relationship_duration_factor_schroeder), bins = 200) +
  theme(legend.title = element_blank(), legend.position = "bottom")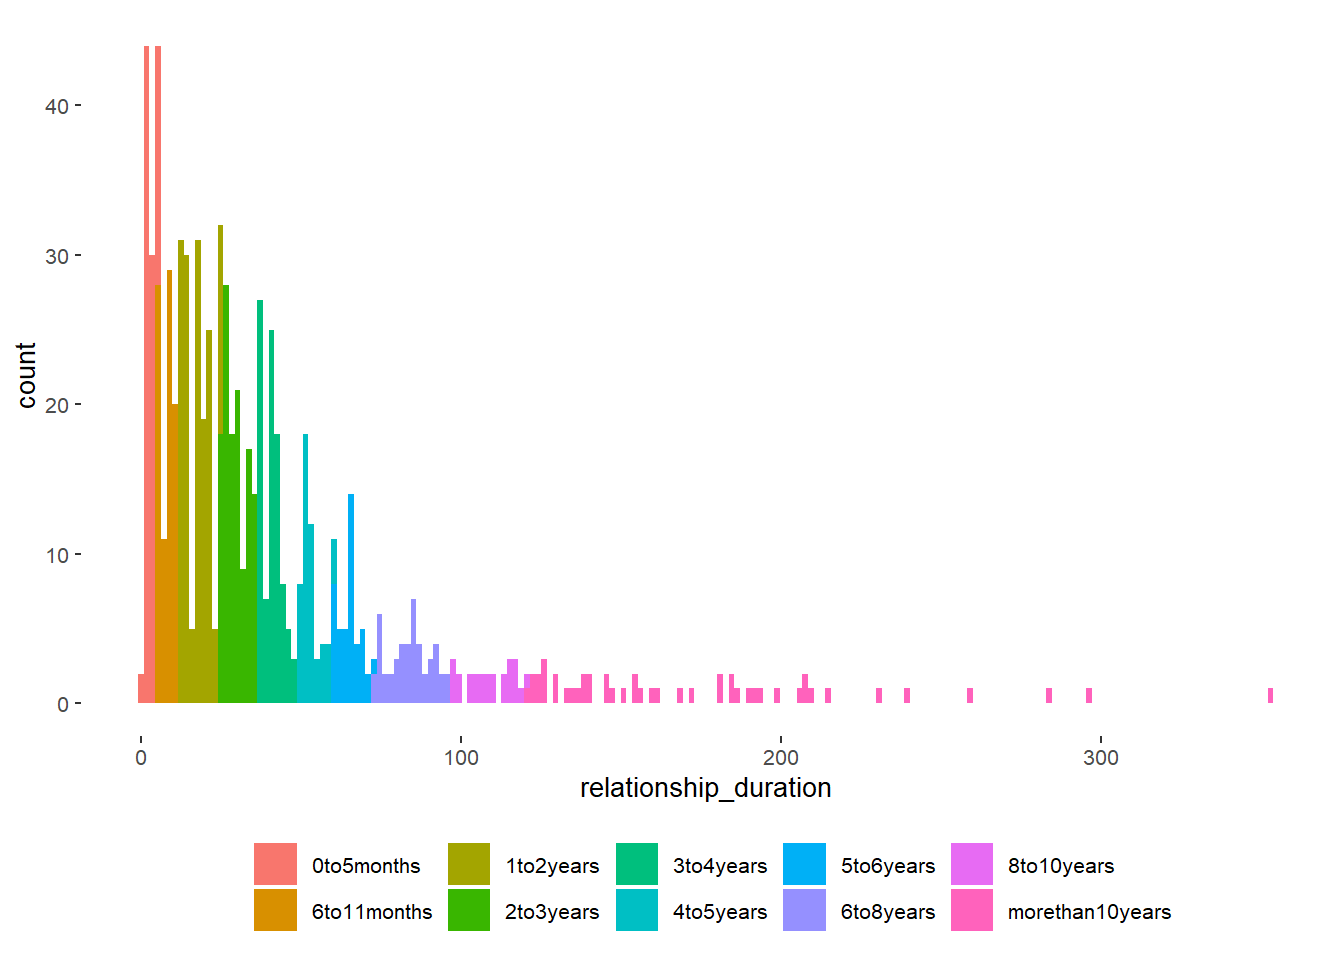
Plots
ggplot(data, aes(relationship_duration_factor_finegrained, diary_libido_mean)) +
  geom_jitter() +
  stat_summary(fun.data=mean_cl_normal, geom="pointrange", color="red")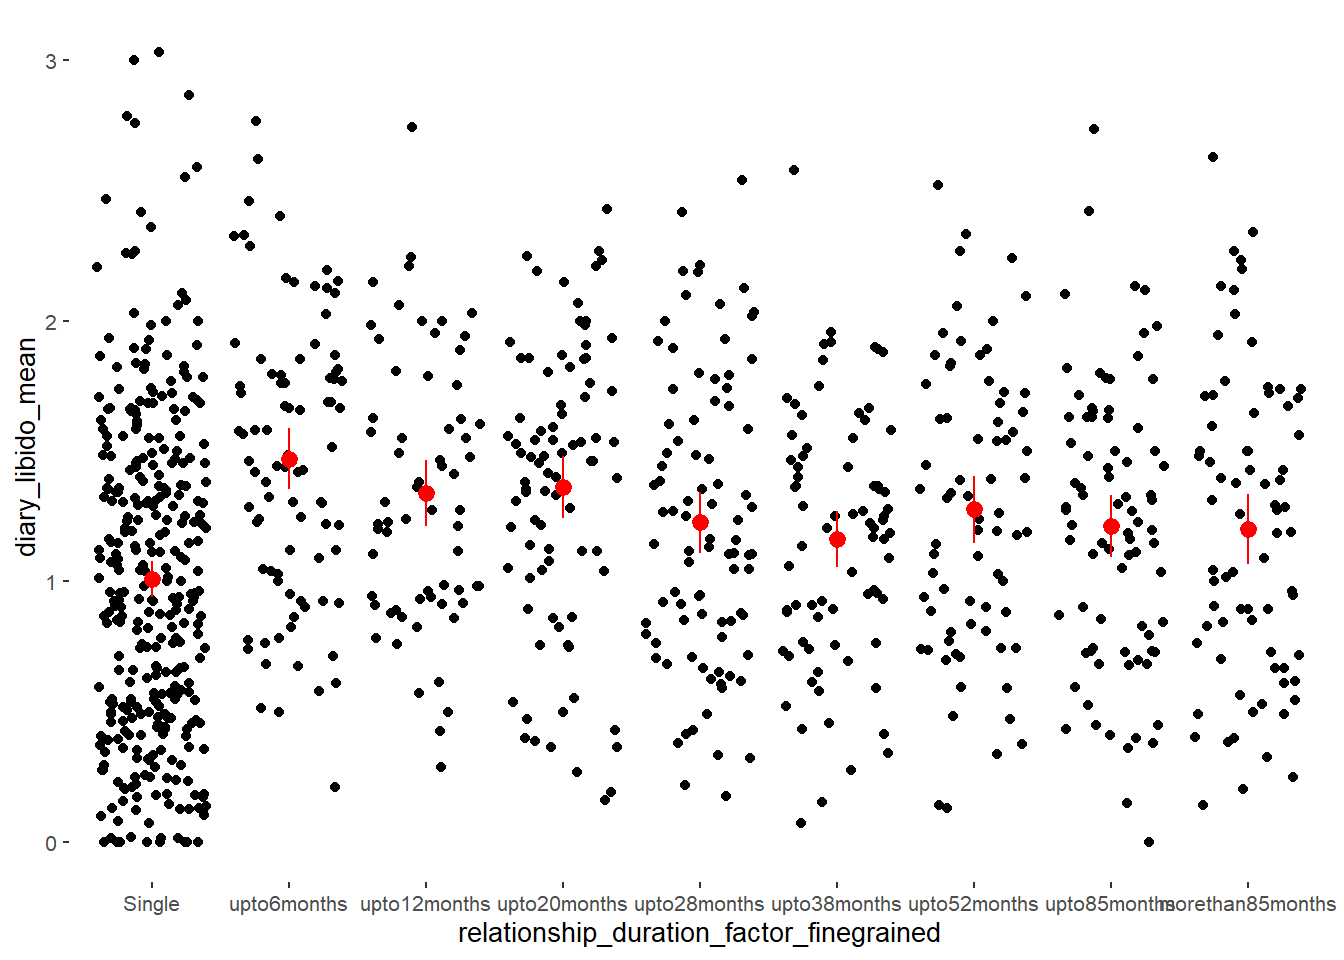
ggplot(data, aes(relationship_duration_factor_finegrained, diary_sex_active_sex_mean)) +
  geom_jitter() +
  stat_summary(fun.data=mean_cl_normal, geom="pointrange", color="red")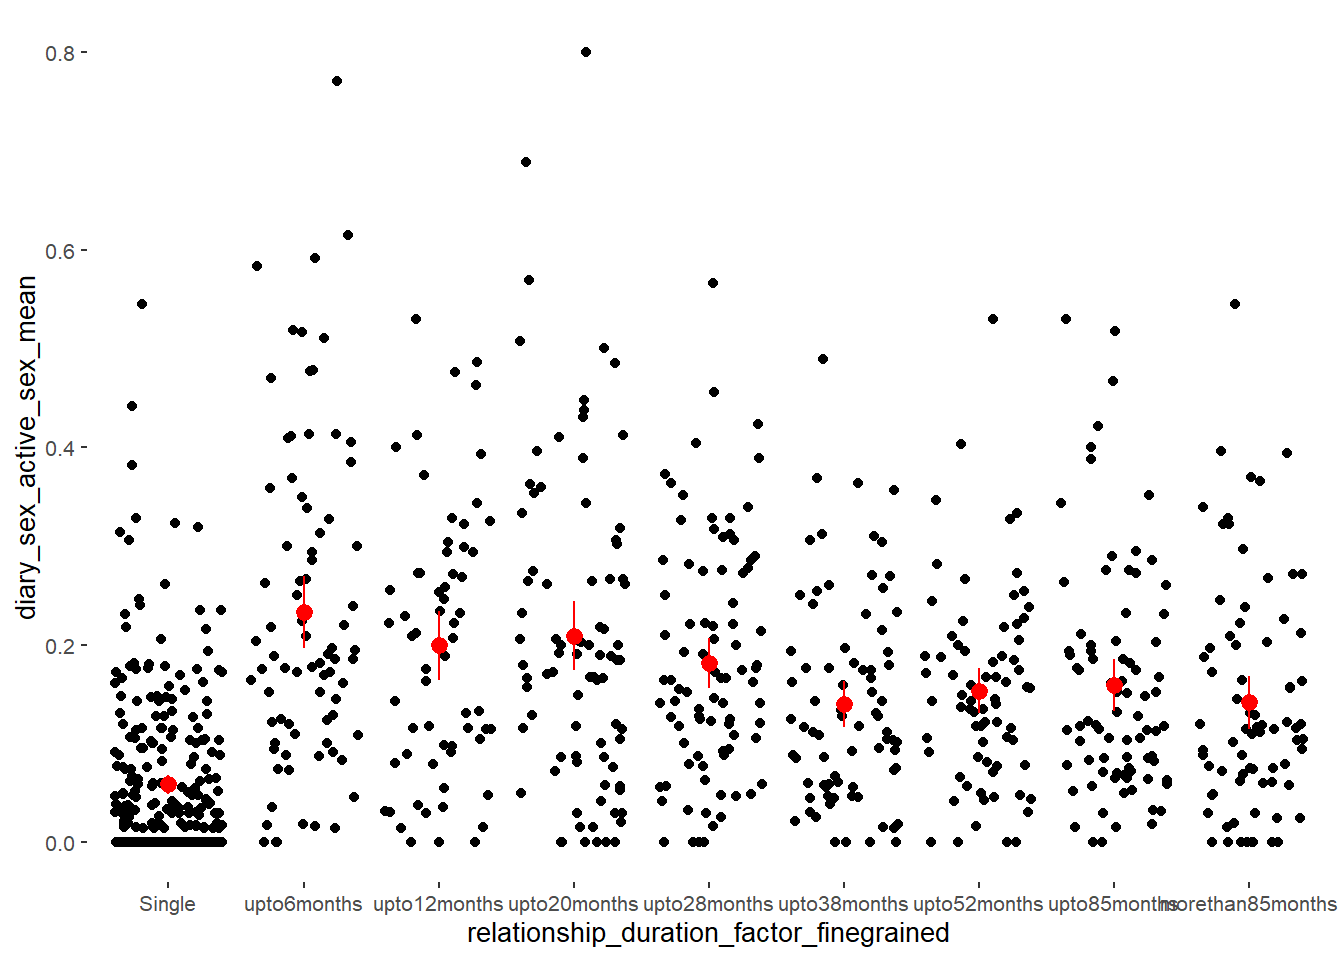
ggplot(data, aes(relationship_duration_factor_finegrained, partner_attractiveness_body)) +
  geom_jitter() +
  stat_summary(fun.data=mean_cl_normal, geom="pointrange", color="red")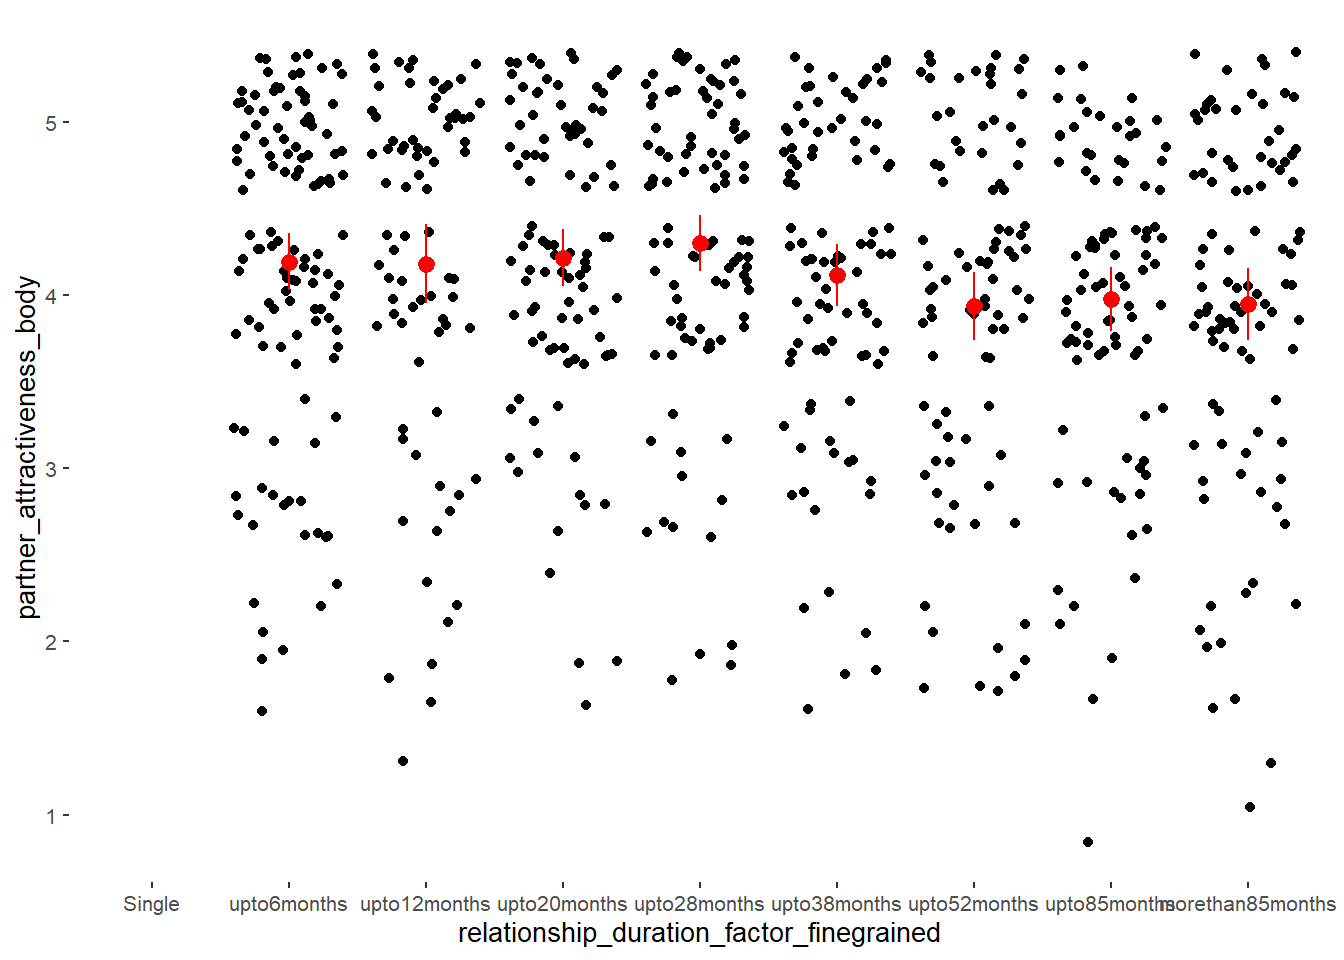
ggplot(data, aes(relationship_duration_factor_finegrained, relationship_satisfaction_overall)) +
  geom_jitter() +
  stat_summary(fun.data=mean_cl_normal, geom="pointrange", color="red")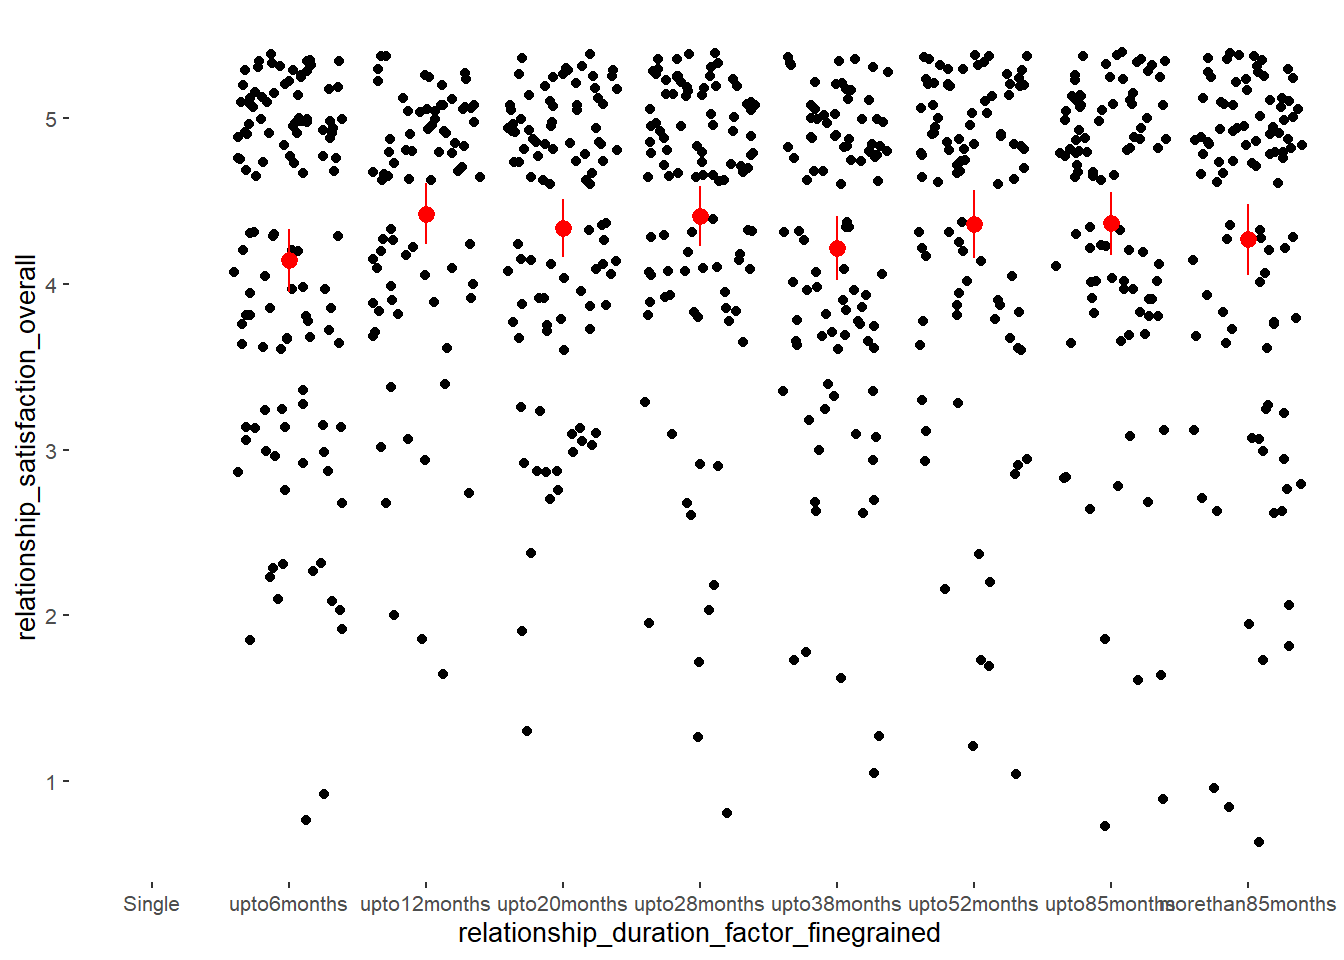
ggplot(data, aes(relationship_duration_factor_finegrained, satisfaction_sexual_intercourse)) +
  geom_jitter() +
  stat_summary(fun.data=mean_cl_normal, geom="pointrange", color="red")
LS0tDQp0aXRsZTogIlJlbGF0aW9uc2hpcCBEdXJhdGlvbiINCm91dHB1dDoNCiAgaHRtbF9kb2N1bWVudDoNCiAgICB0b2M6IHRydWUNCiAgICB0b2NfZGVwdGg6IDQNCiAgICB0b2NfZmxvYXQ6IHRydWUNCiAgICBjb2RlX2ZvbGRpbmc6ICdoaWRlJw0KICAgIHNlbGZfY29udGFpbmVkOiBmYWxzZQ0KLS0tDQoNCg0KIyBEYXRhd3JhbmdsaW5nIHsudGFic2V0fQ0KDQojIyBEYXRhIGFuZCBGdW5jdGlvbnMNCmBgYHtyIGRhdGEgYW5kIGZ1bmN0aW9uLCByZXN1bHRzPSdoaWRlJyxtZXNzYWdlPUYsd2FybmluZz1GfQ0Kc291cmNlKCIwX2hlbHBlcnMuUiIpDQpsb2FkKCJkYXRhL2NsZWFuZWRfc2VsZWN0ZWRfd3JhbmdsZWQucmRhdGEiKQ0KYGBgDQoNCiMjIFdyYW5nbGUgZGF0YSB7LnRhYnNldCAuYWN0aXZlfQ0KDQojIyMgUmVsYXRpb25zaGlwIGR1cmF0aW9uIHsuYWN0aXZlIC50YWJzZXR9DQojIyMjIExpbmVhciByZWxhdGlvbnNoaXAgZHVyYXRpb24NCmBgYHtyIG1lc3NhZ2U9Rix3YXJuaW5nPUZ9DQpxcGxvdChkYXRhJHJlbGF0aW9uc2hpcF9kdXJhdGlvbikNCmBgYA0KDQojIyMjIEZhY3RvcjEgcmVsYXRpb25zaGlwIGR1cmF0aW9uDQpEaXZpZGUgcmVsYXRpb25zaGlwIGR1cmF0aW9uIGludG8gcXVhcnRpbGVzDQpgYGB7ciBtZXNzYWdlPUYsd2FybmluZz1GfQ0KZGF0YSA9IGRhdGEgJT4lDQogICBtdXRhdGUocmVsYXRpb25zaGlwX2R1cmF0aW9uX2ZhY3Rvcl9xdWFydGlsZXMgPSANCiAgICAgICAgICAgIGZhY3RvcihpZmVsc2UocmVsYXRpb25zaGlwX3N0YXR1cyA9PSAiU2luZ2xlIiwNCiAgICAgICAgICAgICAgICAgICAiU2luZ2xlIiwNCiAgICAgICAgICAgICAgICAgICBpZmVsc2UocmVsYXRpb25zaGlwX2R1cmF0aW9uIDw9IDEyLA0KICAgICAgICAgICAgICAgICAgICAgICAgICAidXB0bzEybW9udGhzIiwNCiAgICAgICAgICAgICAgICAgICAgICAgICAgaWZlbHNlKHJlbGF0aW9uc2hpcF9kdXJhdGlvbiA8PSAyOCwgDQogICAgICAgICAgICAgICAgICAgICAgICAgICAgICAgICAidXB0bzI4bW9udGhzIiwNCiAgICAgICAgICAgICAgICAgICAgICAgICAgICAgICAgIGlmZWxzZShyZWxhdGlvbnNoaXBfZHVyYXRpb24gPD0gNTIsDQogICAgICAgICAgICAgICAgICAgICAgICAgICAgICAgICAgICAgICAgInVwdG81Mm1vbnRocyIsDQogICAgICAgICAgICAgICAgICAgICAgICAgICAgICAgICAgICAgICAgaWZlbHNlKHJlbGF0aW9uc2hpcF9kdXJhdGlvbiA+IDUyLA0KICAgICAgICAgICAgICAgICAgICAgICAgICAgICAgICAgICAgICAgICJtb3JldGhhbjUybW9udGhzIiwNCiAgICAgICAgICAgICAgICAgICAgICAgICAgICAgICAgICAgICAgICBOQSkpKSkpLA0KICAgICAgICAgICAgICAgICAgIGxldmVscyA9IGMoIlNpbmdsZSIsICJ1cHRvMTJtb250aHMiLA0KICAgICAgICAgICAgICAgICAgICAgICAgICAgICAgInVwdG8yOG1vbnRocyIsICJ1cHRvNTJtb250aHMiLA0KICAgICAgICAgICAgICAgICAgICAgICAgICAgICAgIm1vcmV0aGFuNTJtb250aHMiKSkpDQoNCg0KZGF0YSAlPiUgDQogIGdyb3VwX2J5KHJlbGF0aW9uc2hpcF9kdXJhdGlvbl9mYWN0b3JfcXVhcnRpbGVzKSAlPiUNCiAgc3VtbWFyaXNlKGNvdW50ID0gbigpKSAlPiUNCiAgYWRkX2NvbHVtbihkdXJhdGlvbl9pbl95ZWFycyA9IGMoIlNpbmdsZSIsDQogICAgICAgICAgICAgICAgICAgICAgICAgICAgICAgICAgICJ1cHRvMXllYXIiLA0KICAgICAgICAgICAgICAgICAgICAgICAgICAgICAgICAgICAidXB0bzIuM3llYXJzIiwNCiAgICAgICAgICAgICAgICAgICAgICAgICAgICAgICAgICAgInVwdG80LjN5ZWFycyIsDQogICAgICAgICAgICAgICAgICAgICAgICAgICAgICAgICAgICJtb3JldGhhbjQuM3llYXJzIikpICU+JQ0KICBzZWxlY3QocmVsYXRpb25zaGlwX2R1cmF0aW9uX2ZhY3Rvcl9xdWFydGlsZXMsIGR1cmF0aW9uX2luX3llYXJzLCBjb3VudCkgJT4lDQogIGthYmxlKCkNCiANCg0KcXBsb3QoZGF0YSRyZWxhdGlvbnNoaXBfZHVyYXRpb25fZmFjdG9yX3F1YXJ0aWxlcykNCg0KDQpwbG90ID0gZ2dwbG90KGRhdGEsIGFlcyhyZWxhdGlvbnNoaXBfZHVyYXRpb24pKSArDQogIGdlb21faGlzdG9ncmFtKGFlcyhmaWxsID0gcmVsYXRpb25zaGlwX2R1cmF0aW9uX2ZhY3Rvcl9xdWFydGlsZXMpLCBiaW5zID0gMzAwKSArDQogIGxhYnMoeCA9ICJSZWxhdGlvbnNoaXAgRHVyYXRpb24gKGluIG1vbnRocykiLA0KICAgICAgIHkgPSAiQ291bnQiKSArIA0KICBzY2FsZV94X2NvbnRpbnVvdXMoYnJlYWtzID0gYyhjKDA6MzApICogMTIpLA0KICAgICAgICAgICAgICAgICAgICAgbGFiZWxzID0gYyhjKDA6MzApICogMTIpKSArDQogIGFwYXRoZW1lICsNCiAgI3RoZW1lKGxlZ2VuZC5wb3NpdGlvbiA9ICJib3R0b20iKSArDQogIHRoZW1lKGF4aXMudGV4dC54ID0gZWxlbWVudF90ZXh0KGFuZ2xlID0gOTAsIHZqdXN0ID0gMC41LCBoanVzdD0xKSkgKw0KICBzY2FsZV9maWxsX21hbnVhbChuYW1lID0gIkNhdGVnb3JpZXNcblJlbGF0aW9uc2hpcFxuRHVyYXRpb24iLA0KICAgICAgICAgICAgICAgICAgICBsYWJlbHMgPSBjKCIw4oCSMTIgbW9udGhzIiwNCiAgICAgICAgICAgICAgICAgICAgICAgICAgICAgICAgICIxM+KAkjI4IG1vbnRocyIsDQogICAgICAgICAgICAgICAgICAgICAgICAgICAgICAgICAiMjnigJI1MiBtb250aHMiLA0KICAgICAgICAgICAgICAgICAgICAgICAgICAgICAgICAgIj4gNTIgbW9udGhzIiksDQogICAgICAgICAgICAgICAgICAgIHZhbHVlcyA9IGMoIiMxQjlFNzciLCAiIzc1NzBCMyIsICIjRDk1RjAyIiwgIiNFNzI5OEEiKSkNCg0KanBlZygnUmVsYXRpb25zaGlwIER1cmF0aW9uLmpwZycsIA0KICAgICB3aWR0aCA9IDcwMCwgaGVpZ2h0ID0gNTAwLCBxdWFsaXR5ID0gMTAwKQ0KcGxvdA0KZGV2Lm9mZigpDQoNCmBgYA0KDQojIyMjIEZhY3RvcjIgcmVsYXRpb25zaGlwIGR1cmF0aW9uDQpEaXZpZGUgcmVsYXRpb25zaGlwIGR1cmF0aW9uIGludG8gOCBxdWFudGlsZXMNCmBgYHtyIG1lc3NhZ2U9Rix3YXJuaW5nPUZ9DQpxdWFudGlsZXMgPSBxdWFudGlsZShhcy5udW1lcmljKGRhdGEkcmVsYXRpb25zaGlwX2R1cmF0aW9uKSwNCiAgICAgICAgICAgICAgICAgICAgIG5hLnJtID0gVCwNCiAgICAgICAgICAgICAgICAgICAgIHByb2JzID0gYygwLCAwLjEyNSwgMC4yNSwgMC4zNzUsIDAuNSwwLjYyNSwgMC43NSwgMC44NzUsIDEpKQ0KDQpkYXRhID0gZGF0YSAlPiUNCiAgbXV0YXRlKHJlbGF0aW9uc2hpcF9kdXJhdGlvbl9mYWN0b3JfZmluZWdyYWluZWQgPSANCiAgICAgICAgICAgZmFjdG9yKGlmZWxzZShyZWxhdGlvbnNoaXBfc3RhdHVzID09ICJTaW5nbGUiLA0KICAgICAgICAgICAgICAgICAgIlNpbmdsZSIsDQogICAgICAgICAgICAgICAgICBpZmVsc2UocmVsYXRpb25zaGlwX2R1cmF0aW9uIDw9IHF1YW50aWxlc1syXSwNCiAgICAgICAgICAgICAgICAgICAgICAgICAidXB0bzZtb250aHMiLA0KICAgICAgICAgICAgICAgICAgICAgICAgIGlmZWxzZShyZWxhdGlvbnNoaXBfZHVyYXRpb24gPD0gcXVhbnRpbGVzWzNdLA0KICAgICAgICAgICAgICAgICAgICAgICAgICAgICAgICAidXB0bzEybW9udGhzIiwNCiAgICAgICAgICAgICAgICAgICAgICAgICAgICAgICAgaWZlbHNlKHJlbGF0aW9uc2hpcF9kdXJhdGlvbiA8PSBxdWFudGlsZXNbNF0sDQogICAgICAgICAgICAgICAgICAgICAgICAgICAgICAgICAgICAgICAidXB0bzIwbW9udGhzIiwNCiAgICAgICAgICAgICAgICAgICAgICAgICAgICAgICAgICAgICAgIGlmZWxzZShyZWxhdGlvbnNoaXBfZHVyYXRpb24gPD0gcXVhbnRpbGVzWzVdLA0KICAgICAgICAgICAgICAgICAgICAgICAgICAgICAgICAgICAgICAgICAgICAgICJ1cHRvMjhtb250aHMiLA0KICAgICAgICAgICBpZmVsc2UocmVsYXRpb25zaGlwX2R1cmF0aW9uIDw9IHF1YW50aWxlc1s2XSwNCiAgICAgICAgICAgICAgICAgICJ1cHRvMzhtb250aHMiLA0KICAgICAgICAgICAgICAgICAgaWZlbHNlKHJlbGF0aW9uc2hpcF9kdXJhdGlvbiA8PSBxdWFudGlsZXNbN10sDQogICAgICAgICAgICAgICAgICAgICAgICAgInVwdG81Mm1vbnRocyIsDQogICAgICAgICAgICAgICAgICAgICAgICAgaWZlbHNlKHJlbGF0aW9uc2hpcF9kdXJhdGlvbiA8PSBxdWFudGlsZXNbOF0sDQogICAgICAgICAgICAgICAgICAgICAgICAgICAgICAgICJ1cHRvODVtb250aHMiLA0KICAgICAgICAgICAgICAgICAgICAgICAgICAgICAgICBpZmVsc2UocmVsYXRpb25zaGlwX2R1cmF0aW9uID4gcXVhbnRpbGVzWzhdLA0KICAgICAgICAgICAgICAgICAgICAgICAgICAgICAgICAgICAgICAgIm1vcmV0aGFuODVtb250aHMiLA0KICAgICAgICAgICAgICAgICAgICAgICAgICAgICAgICAgICAgICAgTkEpKSkpKSkpKSksDQogICAgICAgICAgIGxldmVscyA9IGMoIlNpbmdsZSIsICJ1cHRvNm1vbnRocyIsICJ1cHRvMTJtb250aHMiLA0KICAgICAgICAgICAgICAgICAgICAgICJ1cHRvMjBtb250aHMiLCAidXB0bzI4bW9udGhzIiwNCiAgICAgICAgICAgICAgICAgICAgICAidXB0bzM4bW9udGhzIiwgInVwdG81Mm1vbnRocyIsDQogICAgICAgICAgICAgICAgICAgICAgInVwdG84NW1vbnRocyIsICJtb3JldGhhbjg1bW9udGhzIikpKQ0KDQpkYXRhICU+JSANCiAgZ3JvdXBfYnkocmVsYXRpb25zaGlwX2R1cmF0aW9uX2ZhY3Rvcl9maW5lZ3JhaW5lZCkgJT4lDQogIHN1bW1hcmlzZShjb3VudCA9IG4oKSkgJT4lDQogIGFkZF9jb2x1bW4oZHVyYXRpb25faW5feWVhcnMgPSBjKCJTaW5nbGUiLA0KICAgICAgICAgICAgICAgICAgICAgICAgICAgICAgICAgICAidXB0bzAuNXllYXJzIiwNCiAgICAgICAgICAgICAgICAgICAgICAgICAgICAgICAgICAgInVwdG8xeWVhciIsDQogICAgICAgICAgICAgICAgICAgICAgICAgICAgICAgICAgICJ1cHRvMS43eWVhciIsDQogICAgICAgICAgICAgICAgICAgICAgICAgICAgICAgICAgICJ1cHRvMi4zeWVhcnMiLA0KICAgICAgICAgICAgICAgICAgICAgICAgICAgICAgICAgICAidXB0bzMuMnllYXJzIiwNCiAgICAgICAgICAgICAgICAgICAgICAgICAgICAgICAgICAgInVwdG80LjN5ZWFycyIsDQogICAgICAgICAgICAgICAgICAgICAgICAgICAgICAgICAgICJ1cHRvNy4xeWVhcnMiLA0KICAgICAgICAgICAgICAgICAgICAgICAgICAgICAgICAgICAibW9yZXRoYW43LjF5ZWFycyIpKSAlPiUNCiAgc2VsZWN0KHJlbGF0aW9uc2hpcF9kdXJhdGlvbl9mYWN0b3JfZmluZWdyYWluZWQsIGR1cmF0aW9uX2luX3llYXJzLCBjb3VudCkgICU+JQ0KICBrYWJsZSgpDQoNCnFwbG90KGRhdGEkcmVsYXRpb25zaGlwX2R1cmF0aW9uX2ZhY3Rvcl9maW5lZ3JhaW5lZCkgKw0KICB0aGVtZShheGlzLnRleHQueCA9IGVsZW1lbnRfdGV4dChhbmdsZSA9IDkwLCB2anVzdCA9IDAuNSwgaGp1c3Q9MSkpDQoNCmdncGxvdChkYXRhLCBhZXMocmVsYXRpb25zaGlwX2R1cmF0aW9uKSkgKw0KICBnZW9tX2hpc3RvZ3JhbShhZXMoZmlsbCA9IHJlbGF0aW9uc2hpcF9kdXJhdGlvbl9mYWN0b3JfZmluZWdyYWluZWQpLCBiaW5zID0gMjAwKSArDQogIHRoZW1lKGxlZ2VuZC50aXRsZSA9IGVsZW1lbnRfYmxhbmsoKSwgbGVnZW5kLnBvc2l0aW9uID0gImJvdHRvbSIpDQoNCmBgYA0KDQoNCiMjIyMgRmFjdG9yMyByZWxhdGlvbnNoaXAgZHVyYXRpb24NCmh0dHBzOi8vc2NpLWh1Yi5zdC8xMC4xMDE2L2ouc3NyZXNlYXJjaC4yMDE1LjAxLjAwOQ0KRWZmZWN0cyBvZiByZWxhdGlvbnNoaXAgZHVyYXRpb24sIGNvaGFiaXRhdGlvbiwgYW5kIG1hcnJpYWdlIG9uIHRoZSBmcmVxdWVuY3kgb2YgaW50ZXJjb3Vyc2UgaW4gY291cGxlczogRmluZGluZ3MgZnJvbSBHZXJtYW4gcGFuZWwgZGF0YQ0KDQpSZWxhdGlvbnNoaXAgRHVyYXRpb24NCiogMC01IG1vbnRocw0KKiA2LTExIG1vbnRocw0KKiAxLTIgeWVhcnMNCiogMi0zIHllYXJzDQoqIDMtNCB5ZWFycw0KKiA0LTUgeWVhcnMNCiogNS02IHllYXJzDQoqIDYtOCB5ZWFycw0KKiA4LTEwIHllYXJzDQoqIDEwLTEyIHllYXJzDQoqIDEyLTE0IHllYXJzDQoqIDE0LTE2IHllYXJzDQoqID4gMTYgeWVhcnMNCg0KDQpgYGB7ciBtZXNzYWdlPUYsd2FybmluZz1GfQ0KZGF0YSA9IGRhdGEgJT4lDQogIG11dGF0ZShyZWxhdGlvbnNoaXBfZHVyYXRpb25fZmFjdG9yX3NjaHJvZWRlciA9IA0KICAgICAgICAgICBmYWN0b3IoaWZlbHNlKHJlbGF0aW9uc2hpcF9zdGF0dXMgPT0gIlNpbmdsZSIsDQogICAgICAgICAgICAgICAgICAiU2luZ2xlIiwNCiAgICAgICAgICAgICAgICAgIGlmZWxzZShyZWxhdGlvbnNoaXBfZHVyYXRpb24gPCA2LA0KICAgICAgICAgICAgICAgICAgICAgICAgICIwdG81bW9udGhzIiwNCiAgICAgICAgICAgICAgICAgICAgICAgICBpZmVsc2UocmVsYXRpb25zaGlwX2R1cmF0aW9uIDwgMTIsDQogICAgICAgICAgICAgICAgICAgICAgICAgICAgICAgICI2dG8xMW1vbnRocyIsDQogICAgICAgICAgICAgICAgICAgICAgICAgICAgICAgIGlmZWxzZShyZWxhdGlvbnNoaXBfZHVyYXRpb24gPD0gMjQsDQogICAgICAgICAgICAgICAgICAgICAgICAgICAgICAgICAgICAgICAiMXRvMnllYXJzIiwNCiAgICAgICAgICAgICAgICAgICAgICAgICAgICAgICAgICAgICAgIGlmZWxzZShyZWxhdGlvbnNoaXBfZHVyYXRpb24gPD0gMzYsDQogICAgICAgICAgICAgICAgICAgICAgICAgICAgICAgICAgICAgICAgICAgICAgIjJ0bzN5ZWFycyIsDQogICAgICAgICAgIGlmZWxzZShyZWxhdGlvbnNoaXBfZHVyYXRpb24gPD0gNDgsDQogICAgICAgICAgICAgICAgICAiM3RvNHllYXJzIiwNCiAgICAgICAgICAgICAgICAgIGlmZWxzZShyZWxhdGlvbnNoaXBfZHVyYXRpb24gPD0gNjAsDQogICAgICAgICAgICAgICAgICAgICAgICAgIjR0bzV5ZWFycyIsDQogICAgICAgICAgICAgICAgICAgICAgICAgaWZlbHNlKHJlbGF0aW9uc2hpcF9kdXJhdGlvbiA8PSA3MiwNCiAgICAgICAgICAgICAgICAgICAgICAgICAgICAgICAgIjV0bzZ5ZWFycyIsDQogICAgICAgICAgICAgICAgICAgICAgICAgICAgICAgIGlmZWxzZShyZWxhdGlvbnNoaXBfZHVyYXRpb24gPD0gOTYsDQogICAgICAgICAgICAgICAgICAgICAgICAgICAgICAgICAgICAgICAiNnRvOHllYXJzIiwNCiAgICAgICAgICAgICAgICAgICAgICAgICAgICAgICAgICAgICAgIGlmZWxzZShyZWxhdGlvbnNoaXBfZHVyYXRpb24gPD0gMTIwLA0KICAgICAgICAgICAgICAgICAgICAgICAgICAgICAgICAgICAgICAgICAgICAgICI4dG8xMHllYXJzIiwNCiAgICAgICAgICAgaWZlbHNlKHJlbGF0aW9uc2hpcF9kdXJhdGlvbiA+IDEyMCwgIm1vcmV0aGFuMTB5ZWFycyIsDQogICAgICAgICAgICAgICAgICBOQSkpKSkpKSkpKSkpLA0KICAgICAgICAgICBsZXZlbHMgPSBjKCJTaW5nbGUiLCAiMHRvNW1vbnRocyIsICI2dG8xMW1vbnRocyIsDQogICAgICAgICAgICAgICAgICAgICAgIjF0bzJ5ZWFycyIsICIydG8zeWVhcnMiLA0KICAgICAgICAgICAgICAgICAgICAgICIzdG80eWVhcnMiLCAiNHRvNXllYXJzIiwNCiAgICAgICAgICAgICAgICAgICAgICAiNXRvNnllYXJzIiwgIjZ0bzh5ZWFycyIsDQogICAgICAgICAgICAgICAgICAgICAgIjh0bzEweWVhcnMiLCAibW9yZXRoYW4xMHllYXJzIikpKQ0KDQpkYXRhICU+JSANCiAgZ3JvdXBfYnkocmVsYXRpb25zaGlwX2R1cmF0aW9uX2ZhY3Rvcl9zY2hyb2VkZXIpICU+JQ0KICBzdW1tYXJpc2UoY291bnQgPSBuKCkpICU+JQ0KICBrYWJsZSgpDQogIA0KICANCnFwbG90KGRhdGEkcmVsYXRpb25zaGlwX2R1cmF0aW9uX2ZhY3Rvcl9zY2hyb2VkZXIpICsNCiAgdGhlbWUoYXhpcy50ZXh0LnggPSBlbGVtZW50X3RleHQoYW5nbGUgPSA5MCwgdmp1c3QgPSAwLjUsIGhqdXN0PTEpKQ0KDQoNCmdncGxvdChkYXRhLCBhZXMocmVsYXRpb25zaGlwX2R1cmF0aW9uKSkgKw0KICBnZW9tX2hpc3RvZ3JhbShhZXMoZmlsbCA9IHJlbGF0aW9uc2hpcF9kdXJhdGlvbl9mYWN0b3Jfc2Nocm9lZGVyKSwgYmlucyA9IDIwMCkgKw0KICB0aGVtZShsZWdlbmQudGl0bGUgPSBlbGVtZW50X2JsYW5rKCksIGxlZ2VuZC5wb3NpdGlvbiA9ICJib3R0b20iKQ0KDQpgYGANCg0KIyMgUGxvdHMNCmBgYHtyIG1lc3NhZ2U9Rix3YXJuaW5nPUZ9DQpnZ3Bsb3QoZGF0YSwgYWVzKHJlbGF0aW9uc2hpcF9kdXJhdGlvbl9mYWN0b3JfZmluZWdyYWluZWQsIGRpYXJ5X2xpYmlkb19tZWFuKSkgKw0KICBnZW9tX2ppdHRlcigpICsNCiAgc3RhdF9zdW1tYXJ5KGZ1bi5kYXRhPW1lYW5fY2xfbm9ybWFsLCBnZW9tPSJwb2ludHJhbmdlIiwgY29sb3I9InJlZCIpDQoNCmdncGxvdChkYXRhLCBhZXMocmVsYXRpb25zaGlwX2R1cmF0aW9uX2ZhY3Rvcl9maW5lZ3JhaW5lZCwgZGlhcnlfc2V4X2FjdGl2ZV9zZXhfbWVhbikpICsNCiAgZ2VvbV9qaXR0ZXIoKSArDQogIHN0YXRfc3VtbWFyeShmdW4uZGF0YT1tZWFuX2NsX25vcm1hbCwgZ2VvbT0icG9pbnRyYW5nZSIsIGNvbG9yPSJyZWQiKQ0KDQpnZ3Bsb3QoZGF0YSwgYWVzKHJlbGF0aW9uc2hpcF9kdXJhdGlvbl9mYWN0b3JfZmluZWdyYWluZWQsIHBhcnRuZXJfYXR0cmFjdGl2ZW5lc3NfYm9keSkpICsNCiAgZ2VvbV9qaXR0ZXIoKSArDQogIHN0YXRfc3VtbWFyeShmdW4uZGF0YT1tZWFuX2NsX25vcm1hbCwgZ2VvbT0icG9pbnRyYW5nZSIsIGNvbG9yPSJyZWQiKQ0KDQpnZ3Bsb3QoZGF0YSwgYWVzKHJlbGF0aW9uc2hpcF9kdXJhdGlvbl9mYWN0b3JfZmluZWdyYWluZWQsIHJlbGF0aW9uc2hpcF9zYXRpc2ZhY3Rpb25fb3ZlcmFsbCkpICsNCiAgZ2VvbV9qaXR0ZXIoKSArDQogIHN0YXRfc3VtbWFyeShmdW4uZGF0YT1tZWFuX2NsX25vcm1hbCwgZ2VvbT0icG9pbnRyYW5nZSIsIGNvbG9yPSJyZWQiKQ0KDQpnZ3Bsb3QoZGF0YSwgYWVzKHJlbGF0aW9uc2hpcF9kdXJhdGlvbl9mYWN0b3JfZmluZWdyYWluZWQsIHNhdGlzZmFjdGlvbl9zZXh1YWxfaW50ZXJjb3Vyc2UpKSArDQogIGdlb21faml0dGVyKCkgKw0KICBzdGF0X3N1bW1hcnkoZnVuLmRhdGE9bWVhbl9jbF9ub3JtYWwsIGdlb209InBvaW50cmFuZ2UiLCBjb2xvcj0icmVkIikNCmBgYA0KDQo=